
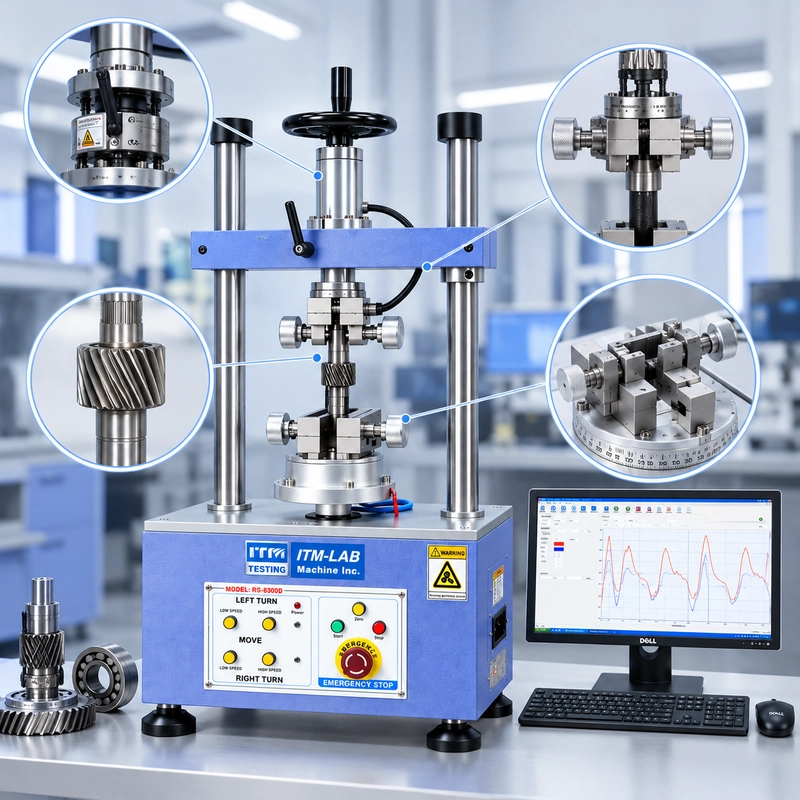
A customer tells us, “The shaft torque is about 0.8 N·m.”
That sounds like enough information to choose a torque tester. In practice, it usually isn’t.
The first questions we would ask are: Is 0.8 N·m the running torque or the highest torque? What happens when the shaft first starts moving? Does the torque change through the rotation?
A component that runs at 0.8 N·m may need 1.2 N·m to break free from rest. Later in the same rotation, a seal, bearing, gear interface, or another mechanical transition might produce a brief 1.4 N·m peak.
None of those values is necessarily wrong. They describe different parts of the same mechanical event.
This distinction matters when testing shafts, bearings, bushings, seals, couplings, rotary joints, and other mechanical assemblies. It also matters when selecting the torque range, because sizing a sensor around normal running torque alone can leave the actual peak outside the intended measurement range.
A useful shaft torque test therefore starts by defining the event—not by choosing the machine capacity.
This guide explains how to distinguish breakaway torque, running torque, and peak torque, how to read a torque-angle curve, and what we look at when configuring fixtures, speed, direction, alignment, sensor range, and data acquisition for a rotary component test.
What Does a Shaft Torque Test Actually Measure?
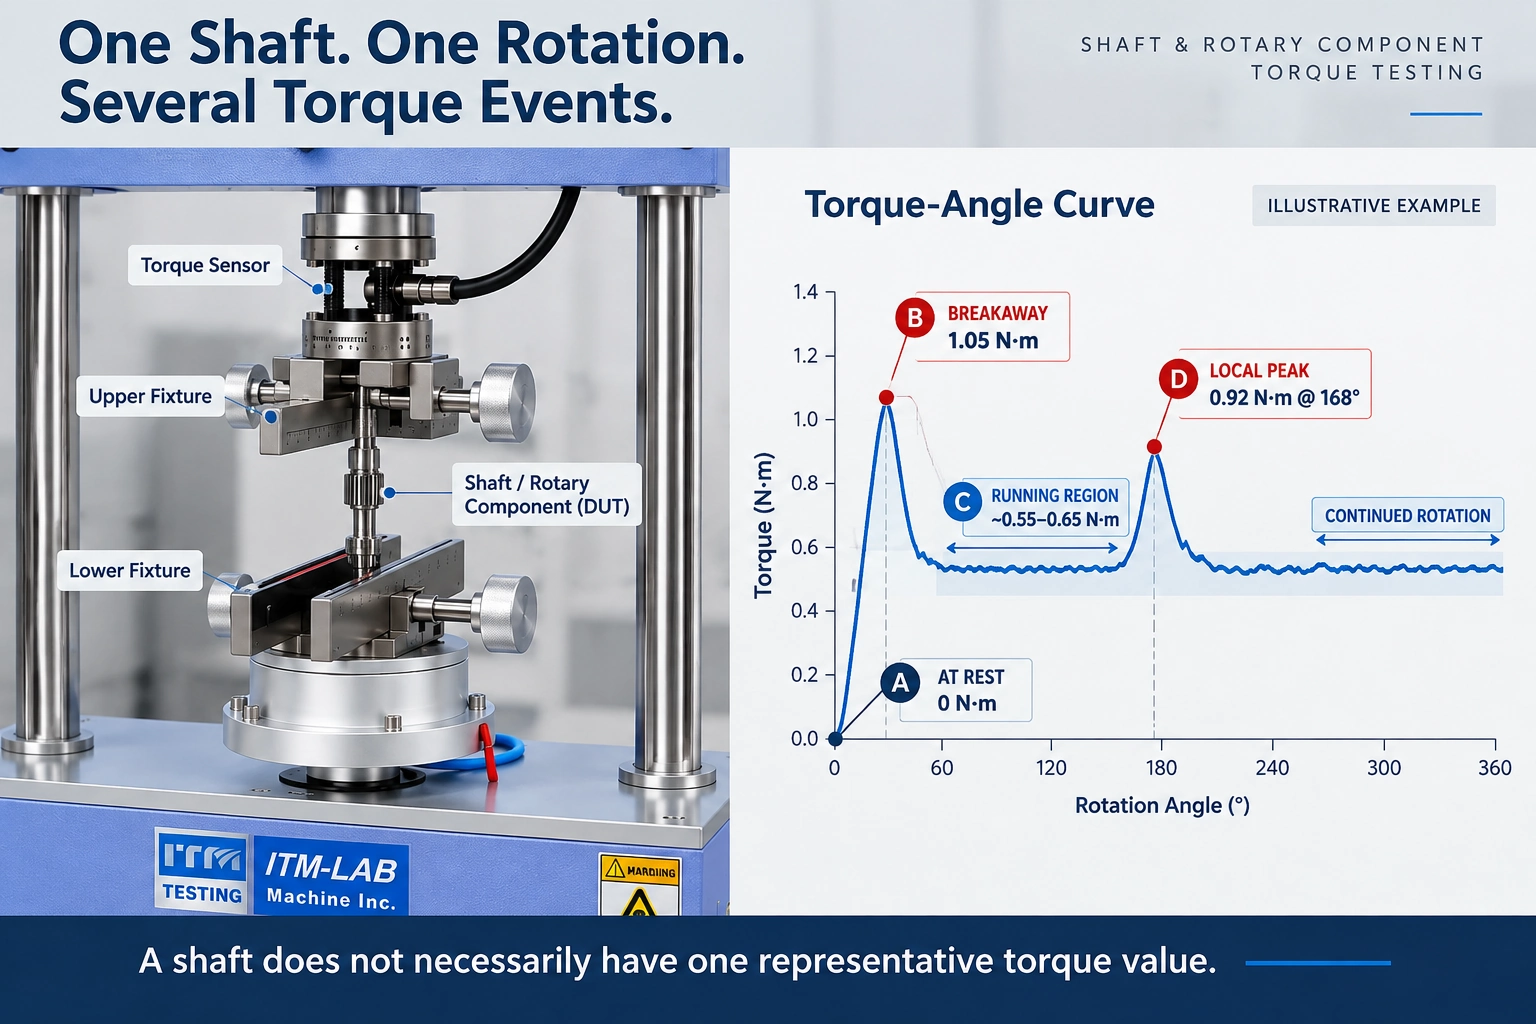
At its simplest, a shaft torque test measures the rotational resistance of a component under controlled motion.
The DUT is mounted in a fixture, rotation is applied around its functional axis, and the torque response is measured.
What we need from the test depends on the component.
For a bearing assembly, the concern might be the torque needed to initiate rotation. For a rotary seal, the running resistance may matter more. For a geared mechanism, one maximum value may tell us very little because the resistance changes repeatedly with angular position.
That is why, before configuring a test, it helps to separate the possible measurements:
| Measurement | What We Are Looking At |
|---|---|
| Breakaway Torque | Resistance as the component begins moving from rest |
| Running Torque | Resistance after rotation has started |
| Peak Torque | Highest torque reached during the defined test |
| Average Torque | Average resistance over a specified region |
| Torque Variation | How much resistance changes during rotation |
| Angular Position | Where a particular torque event occurs |
| CW / CCW Torque | Whether behavior changes with direction |
| Torque-Angle Curve | The complete torque response through rotation |
A “shaft torque test” also does not mean that the DUT must be a bare shaft. The same measurement approach can be used for bearings, bushings, couplings, rotary seals, joints, geared mechanisms, adjustment assemblies, and complete rotary components.
One distinction is worth making early: this article is about mechanical rotational resistance, not motor performance testing.
A motor test may characterize output torque, speed, power, and efficiency under load. Here, the question is different: How much resistance does the component itself produce as it begins and continues to rotate?
Breakaway Torque: What Happens at the Start?
Consider a bearing-and-seal shaft assembly.
For illustration, suppose the DUT has been mounted, aligned, and allowed to remain stationary before the test begins. The tester starts rotating at the defined speed.
Torque rises.
The shaft is still stationary.
The reading reaches:
1.05 N·m
The shaft begins to move, and torque drops into a much lower band:
0.55–0.65 N·m
That initial 1.05 N·m event is the breakaway torque.
Breakaway torque—sometimes called starting torque in a product specification—is associated with overcoming the resistance present at the transition from rest to motion.
The difference between breakaway and running torque can come from several places: static friction, seal contact, bearing preload, lubricant condition, surface adhesion, or mechanical interference.
The important part during an actual test is not to assume the cause from the number alone.
If we see an unexpectedly high breakaway value, we first confirm the test condition: Was the DUT mounted the same way? Was the same starting position used? Had the component been stationary for the same period? Did anything slip in the fixture?
Only after the setup is controlled does the torque difference become useful for comparing components.
For our illustrative DUT:
Breakaway: 1.05 N·m
Running region: 0.55–0.65 N·m
That difference also immediately tells us something about equipment selection: a torque range chosen around the 0.6 N·m running value alone would be the wrong starting point.
Running Torque Is Often a Region, Not One Number
Once the shaft begins moving, the curve enters the running region.
This is where we often see another oversimplification in test requests:
“Running torque: 0.6 N·m.”
That may be a perfectly valid specification. But when we look at the actual curve, the resistance may move between 0.55 and 0.65 N·m rather than sitting on a perfectly flat 0.60 N·m line.
That is normal for many real mechanical assemblies.
A seal can produce a broad band of friction. A geared mechanism may show a repeating pattern. A bearing assembly may be stable through most of a revolution and then rise slightly at one angular position.
Depending on the test requirement, our illustrative running region could be reported as:
Mean: 0.60 N·m
Minimum: 0.55 N·m
Maximum: 0.65 N·m
Peak-to-Peak Variation: 0.10 N·m
These values are examples, not acceptance limits.
The correct reporting method should come from the customer's drawing, specification, test procedure, or engineering objective.
This is why we prefer to clarify what “running torque” means before configuring the data output. Some customers need one average value for production inspection. Others need minimum, maximum, and average values. For troubleshooting or development work, the complete curve may be more useful than any of them.
Breakaway Torque Is Not Automatically Peak Torque
This distinction is easy to miss.
Breakaway torque and peak torque are often the same value because the largest resistance frequently occurs when the component first starts moving.
But they do not mean the same thing.
Breakaway torque identifies an event.
It occurs at the transition from rest to motion.
Peak torque identifies a magnitude.
It is simply the highest measured torque within the defined test.
Suppose a shaft produces:
Breakaway: 1.05 N·m
and no later point exceeds that value.
In this case, the breakaway torque is also the peak torque.
Now consider another DUT:
Breakaway: 0.90 N·m
After motion begins, the component settles around 0.60 N·m. At 220°, however, resistance rises to:
1.20 N·m
Now:
Breakaway Torque = 0.90 N·m
Peak Torque = 1.20 N·m
That 1.20 N·m peak gives us a location to investigate. It does not tell us automatically whether the cause is a bearing, seal, gear interface, interference, alignment problem, or something else.
That is where the torque-angle curve becomes much more useful than the maximum value alone.
Reading a Torque-Angle Curve
When we review rotary test data, the maximum torque is usually one of the first numbers we see.
It answers:
How high did the torque get?
The curve answers another question:
Where did it happen?
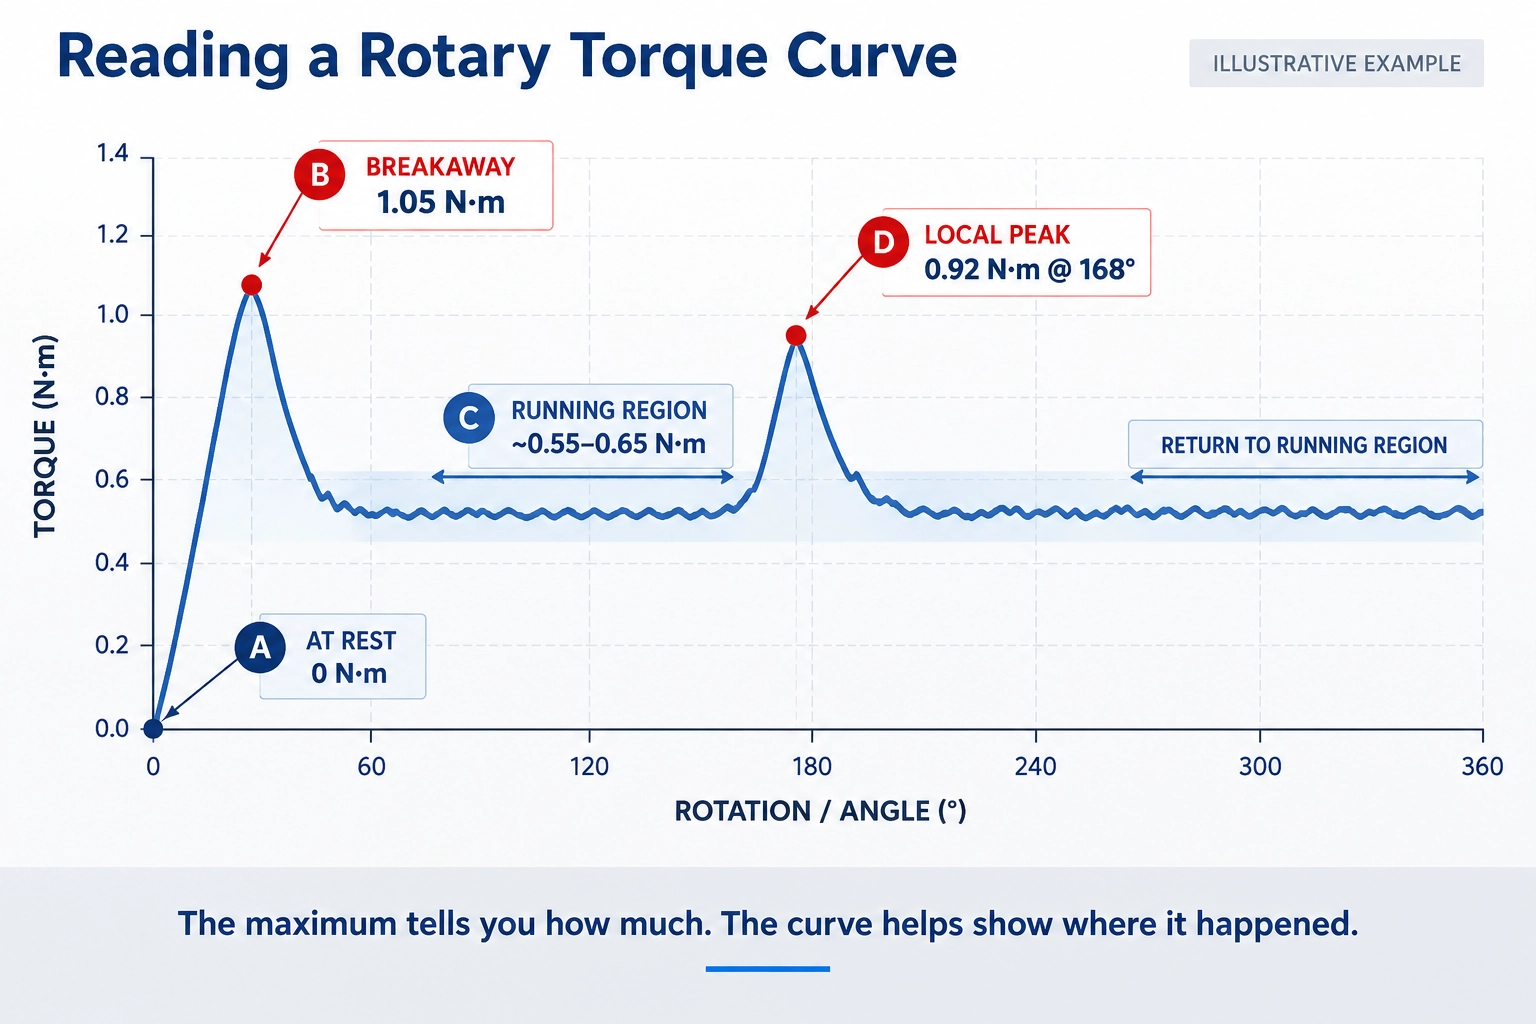
Return to our illustrative shaft assembly.
At the beginning of the test, torque climbs to a 1.05 N·m breakaway peak.
Once the shaft starts moving, it settles into a 0.55–0.65 N·m running region.
Then, near 168°, torque rises to 0.92 N·m before dropping back into the normal running band.
If the report stored only:
Maximum Torque = 1.05 N·m
the 168° event would disappear from the result.
The curve makes it visible.
What we would not do is immediately label the 0.92 N·m rise a “bearing defect.” The data has not proven that.
Instead, it gives us a better set of questions:
Does the rise appear again near 168° on the next run?
Does it remain after the DUT is removed and remounted?
Does another sample show the same pattern?
Does it occur in both rotational directions?
The curve narrows the investigation. It does not replace it.
Same Peak Torque. Different Mechanical Behavior.
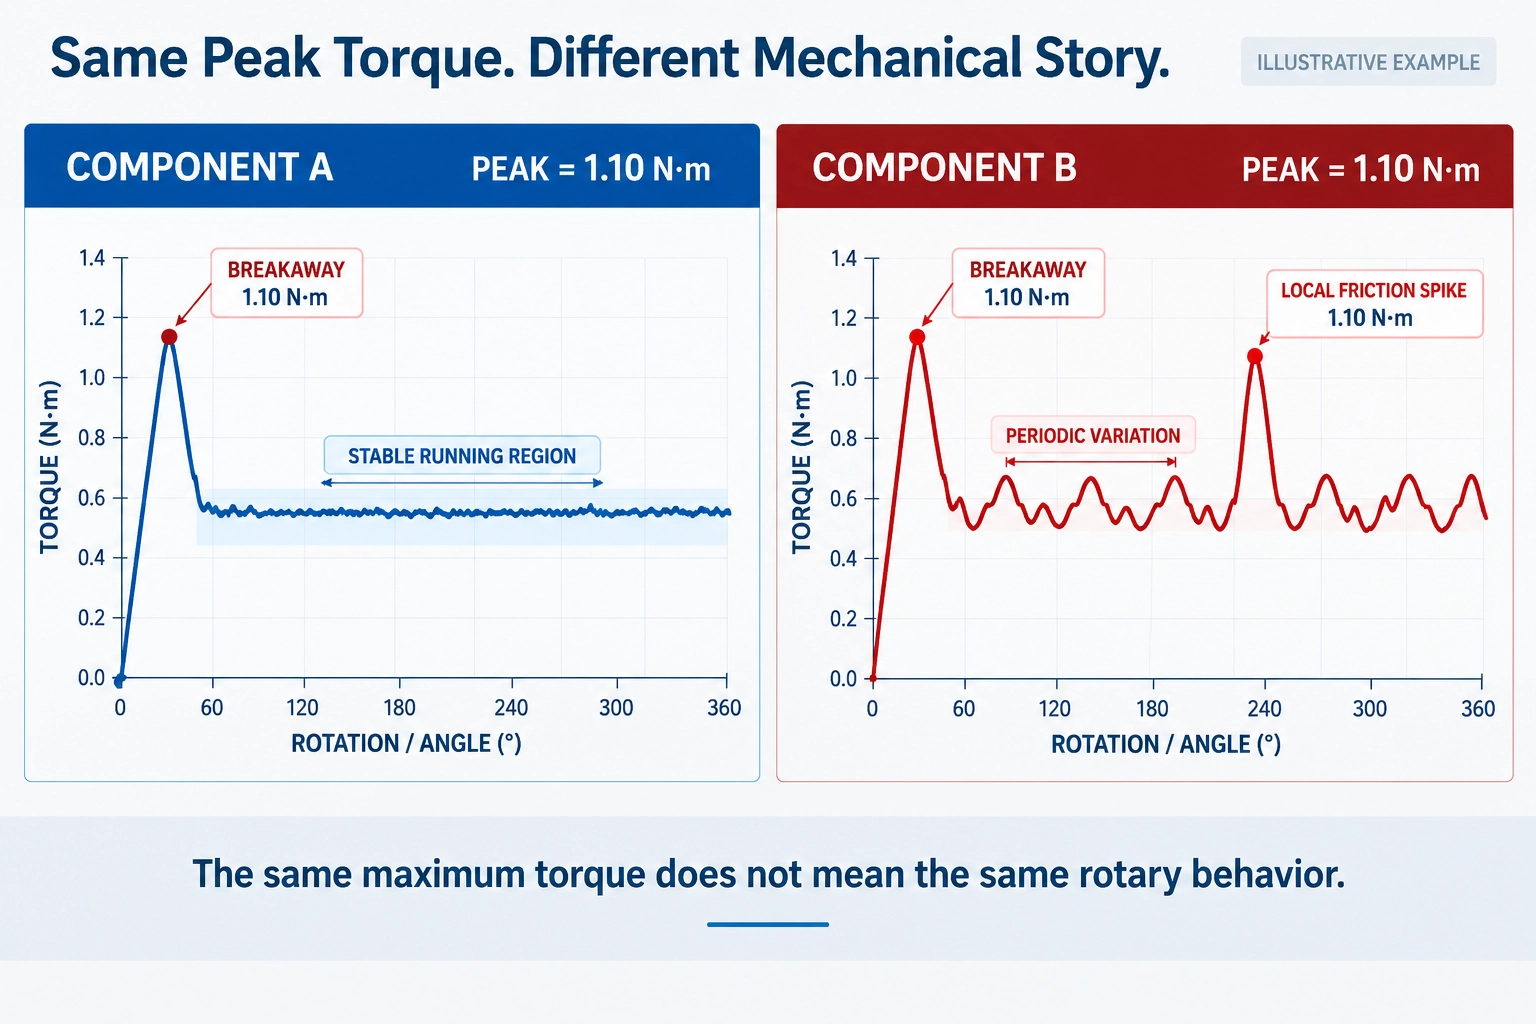
A useful example from rotary testing is two components that pass the same peak-torque limit but produce very different curves.
Assume both reach:
1.10 N·m
Component A shows a clear initial breakaway event. The torque then drops and remains within a relatively stable running band.
Component B reaches the same maximum, but its running region contains a repeating rise and fall. One angular position also produces a narrow torque spike.
If the inspection record contains only:
Peak = 1.10 N·m
those two components look identical.
They are not behaving identically.
That still does not mean Component B fails. A geared or indexed mechanism, for example, may naturally produce periodic resistance. The drawing or test specification must tell us what is acceptable.
But if the engineering objective is to compare rotational behavior, one maximum value has thrown away most of the useful information.
Rotational Speed Is a Test Condition
One detail we always want to know when discussing a rotary torque application is speed.
A customer may provide:
Torque: 2 N·m
Rotation: 360°
but leave out rpm.
For some components, that missing number matters.
Lubricant behavior, seal friction, viscous resistance, and dynamic contact can make the measured torque sensitive to rotational speed. A test performed at 5 rpm therefore should not automatically be compared with one performed at 60 rpm.
That does not mean every DUT will show a meaningful difference. Some will be relatively insensitive over the relevant range.
The practical rule is:
If speed changes, treat it as a changed test condition unless the method has already established otherwise.
We do not recommend a universal “best speed” for shaft torque testing because there is no meaningful value that applies to every bearing, seal, coupling, or rotary mechanism.
Use the speed defined by the product specification, validated internal method, engineering requirement, or actual application objective—and include it in the test record.
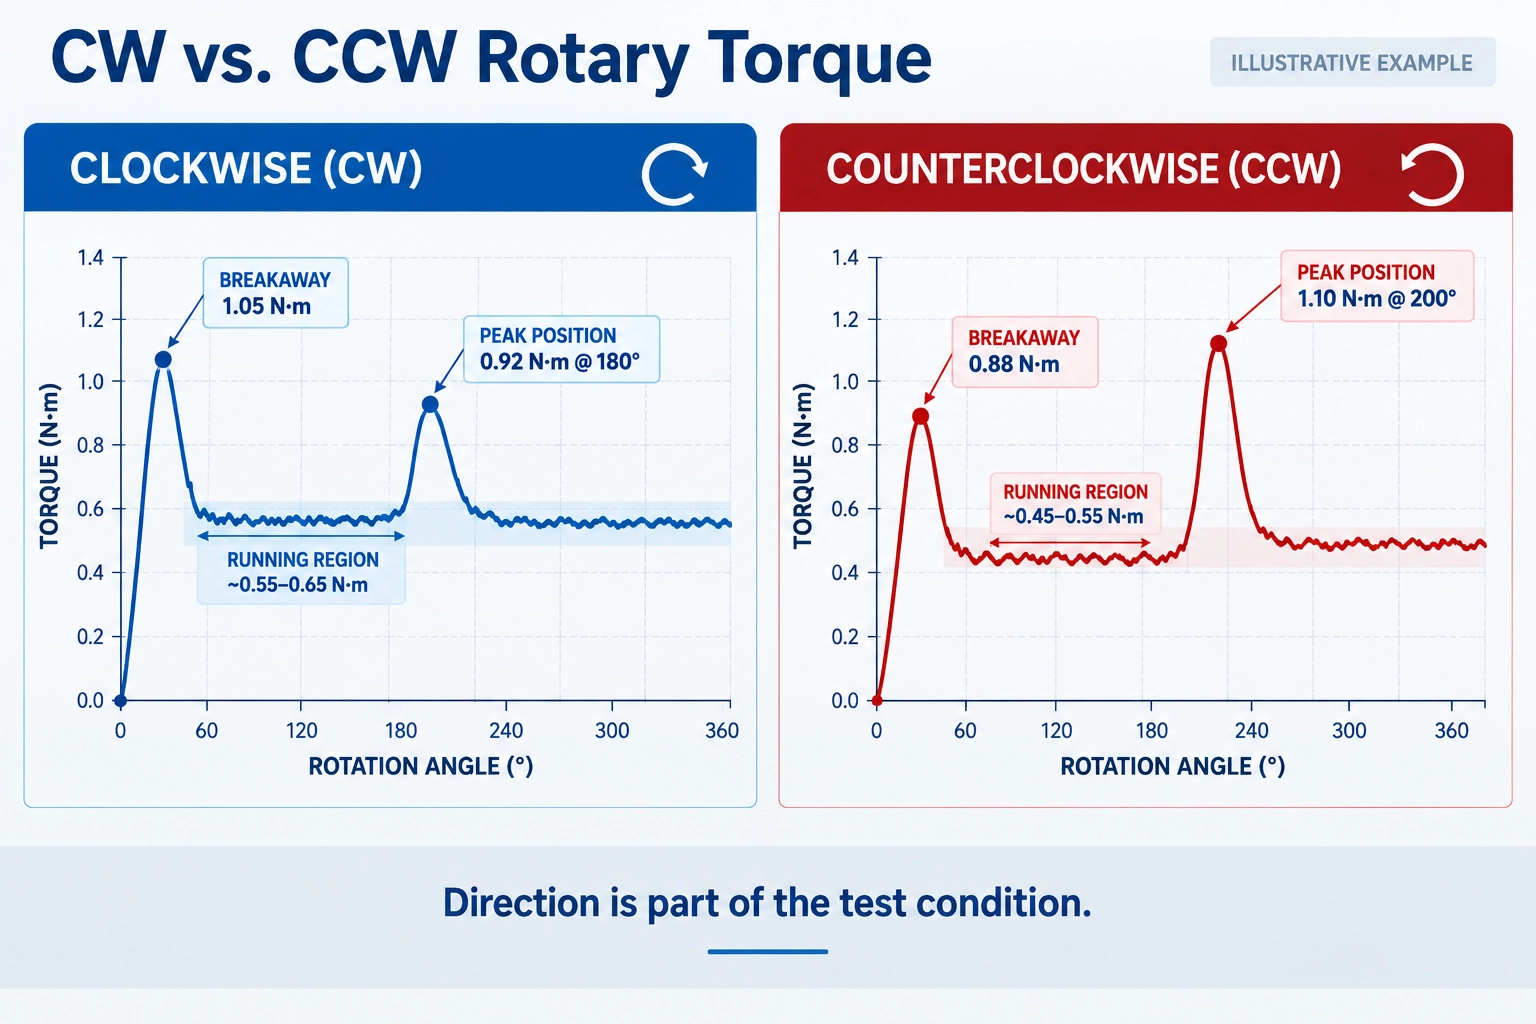
CW and CCW Are Not Automatically Equivalent
Direction is another field that is sometimes missing from an initial inquiry.
If the DUT operates in both directions, we want to know whether the test needs:
CW
CCW
or:
Both
A rotary assembly might show:
CW Breakaway: 0.82 N·m
CCW Breakaway: 0.96 N·m
The running region or angular position of a local peak may differ as well.
Seal orientation, threads, bearing conditions, assembly preload, gear geometry, or other asymmetric mechanical features can contribute to directional differences.
Again, the curve tells us that the behavior changed. It does not prove which internal mechanism caused the change.
If both directions matter in service, both should normally be defined in the test rather than assuming that one direction represents the other.
Fixture and Alignment: Where Good Sensors Produce Bad Tests
A precise torque sensor does not guarantee a valid shaft torque test.
Some of the most important problems happen before the sensor becomes the limiting factor.
Align to the Functional Axis
With a simple shaft, the rotational axis may be obvious.
With a complete assembly, it may not be.
An irregular housing can look visually off-center even when the actual shaft axis is correctly positioned. The opposite is also possible: the housing looks centered while the functional rotational axis is not aligned with the tester.
We therefore care about the functional datum—the shaft centerline, bearing axis, coupling axis, or another defined mounting reference—not whether the sample looks centered in a photograph.
Poor alignment can introduce side loading, additional bearing resistance, coupling forces, or fixture deformation into the measurement.
Hold the Part Without Changing It
The fixture must prevent the DUT from moving, but simply tightening harder is not a good solution.
We pay particular attention to thin housings, bearing supports, plastic bodies, and components where clamping force can alter internal preload or geometry.
If the fixture changes the DUT, the sensor may measure that change very accurately.
It is still the wrong test.
Verify the Fixture at Breakaway, Not Just Running Torque
This is a practical point that becomes obvious once the complete torque event is considered.
A fixture may hold perfectly well while the shaft is running at 0.60 N·m.
Then breakaway reaches 1.05 N·m and the DUT moves slightly inside the grip.
The resulting curve can still look clean.
For that reason, fixture holding capability needs to be checked around the highest expected torque event, not just the normal running region.
Check Repeatability Before Diagnosing a Peak
Suppose we see that same 0.92 N·m rise near 168°.
Before deciding what it means, we run the test again.
If the peak appears repeatedly near the same angular position, it becomes much more useful for mechanical investigation.
If it moves to 90°, then 240°, then disappears entirely, we would also look carefully at the test setup.
Did the DUT slip?
Was the start angle reproduced?
Did the mounting position change?
Was the speed identical?
Was the shaft realigned after remounting?
This is one reason repeatability is so important when using a rotary torque test for troubleshooting.
A single unusual point is an observation.
A repeatable event under controlled conditions is much stronger evidence that there is a consistent mechanical behavior worth investigating.
Even then, the curve tells us where to investigate, not automatically what failed.
Why Rotary Torque Tests Go Wrong
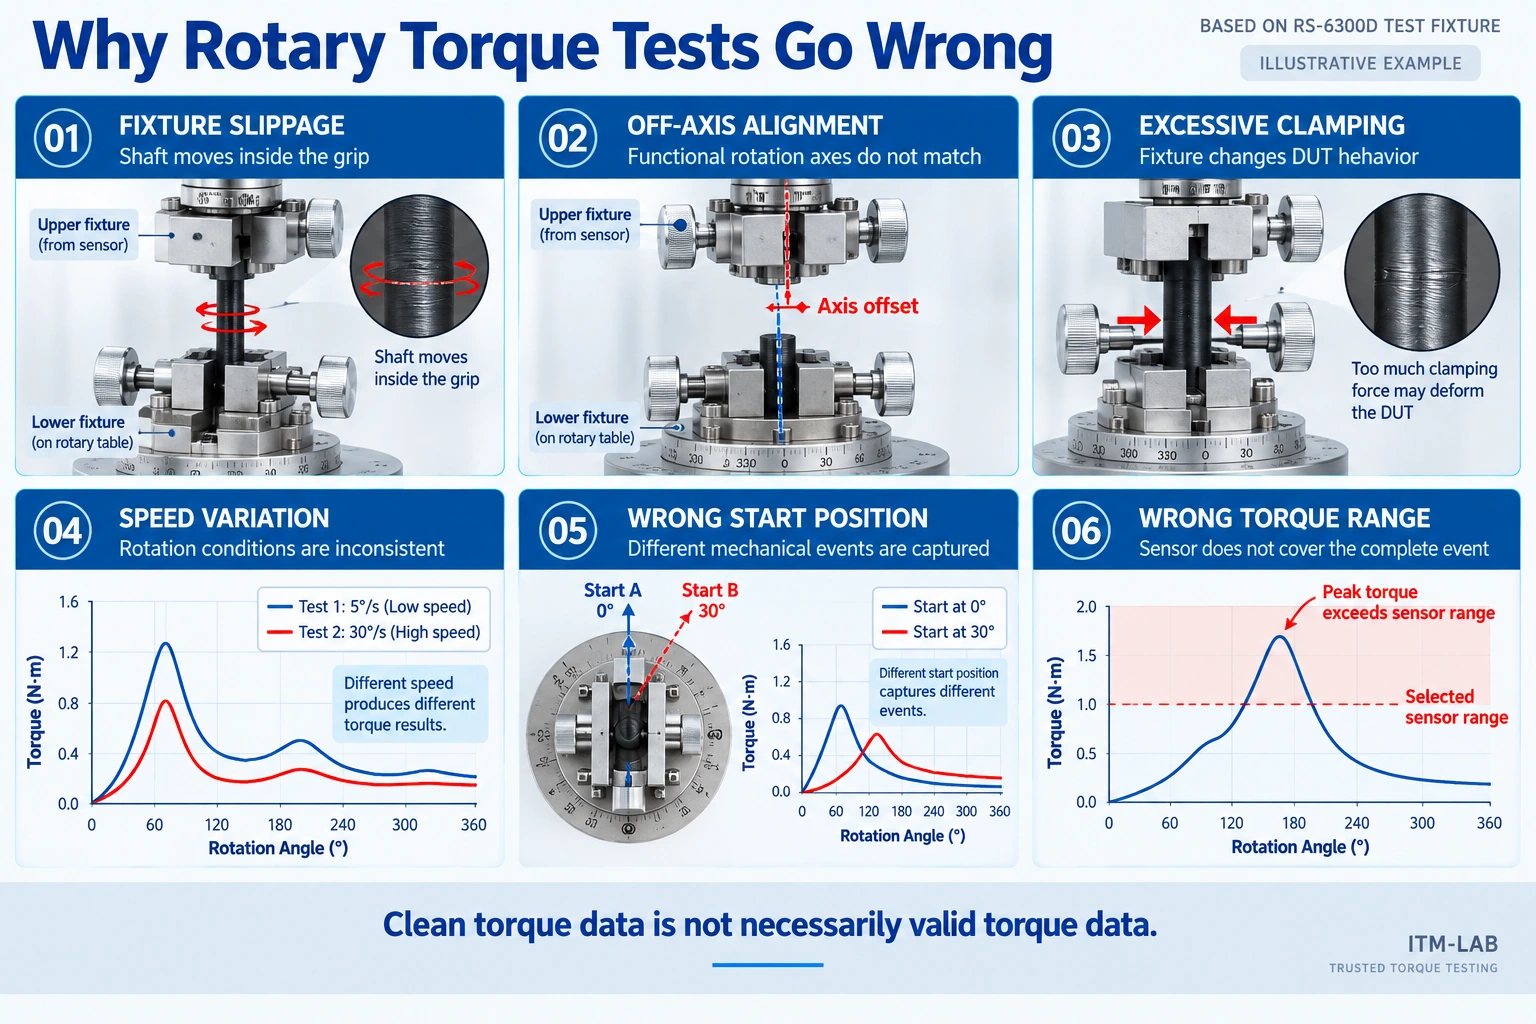
When a curve does not look right, we usually start with the setup before blaming the DUT.
Fixture slippage is one obvious problem, but not the only one. A small axis offset can introduce resistance. Excessive clamping can change the assembly itself. Different start positions can move mechanical events to different places in the captured data.
Speed also needs to be consistent.
Then there is the torque range.
A system selected around 0.6 N·m running torque may look perfectly suitable until the first 1.2 N·m breakaway event occurs.
The difficult part is that several of these problems still produce clean-looking graphs.
Clean data is not necessarily valid data.
Select the Torque Range Around the Complete Event
If a customer tells us:
Running torque: approximately 0.6 N·m
we would not select the sensor from that number alone.
We would still want to know:
What is the breakaway torque?
What is the highest expected peak?
How much product-to-product variation is expected?
Return to the example used throughout this guide:
Running Region: 0.55–0.65 N·m
Breakaway: 1.05 N·m
Local Peak: 0.92 N·m
Describing that DUT simply as a “0.6 N·m shaft” leaves out the event that actually determines the minimum required headroom.
The opposite approach—selecting a much larger sensor simply to be safe—is not automatically better either. The meaningful measurements may then occupy a very small portion of the selected range.
Capacity, expected peaks, accuracy specification, resolution, normal working region, and overload allowance should be considered together.
For the detailed range-selection discussion, see:
How to Select the Right Torque Range for a Torque Tester
For shaft and rotary component testing, the practical takeaway is simple:
Do not size the measurement system from running torque alone.
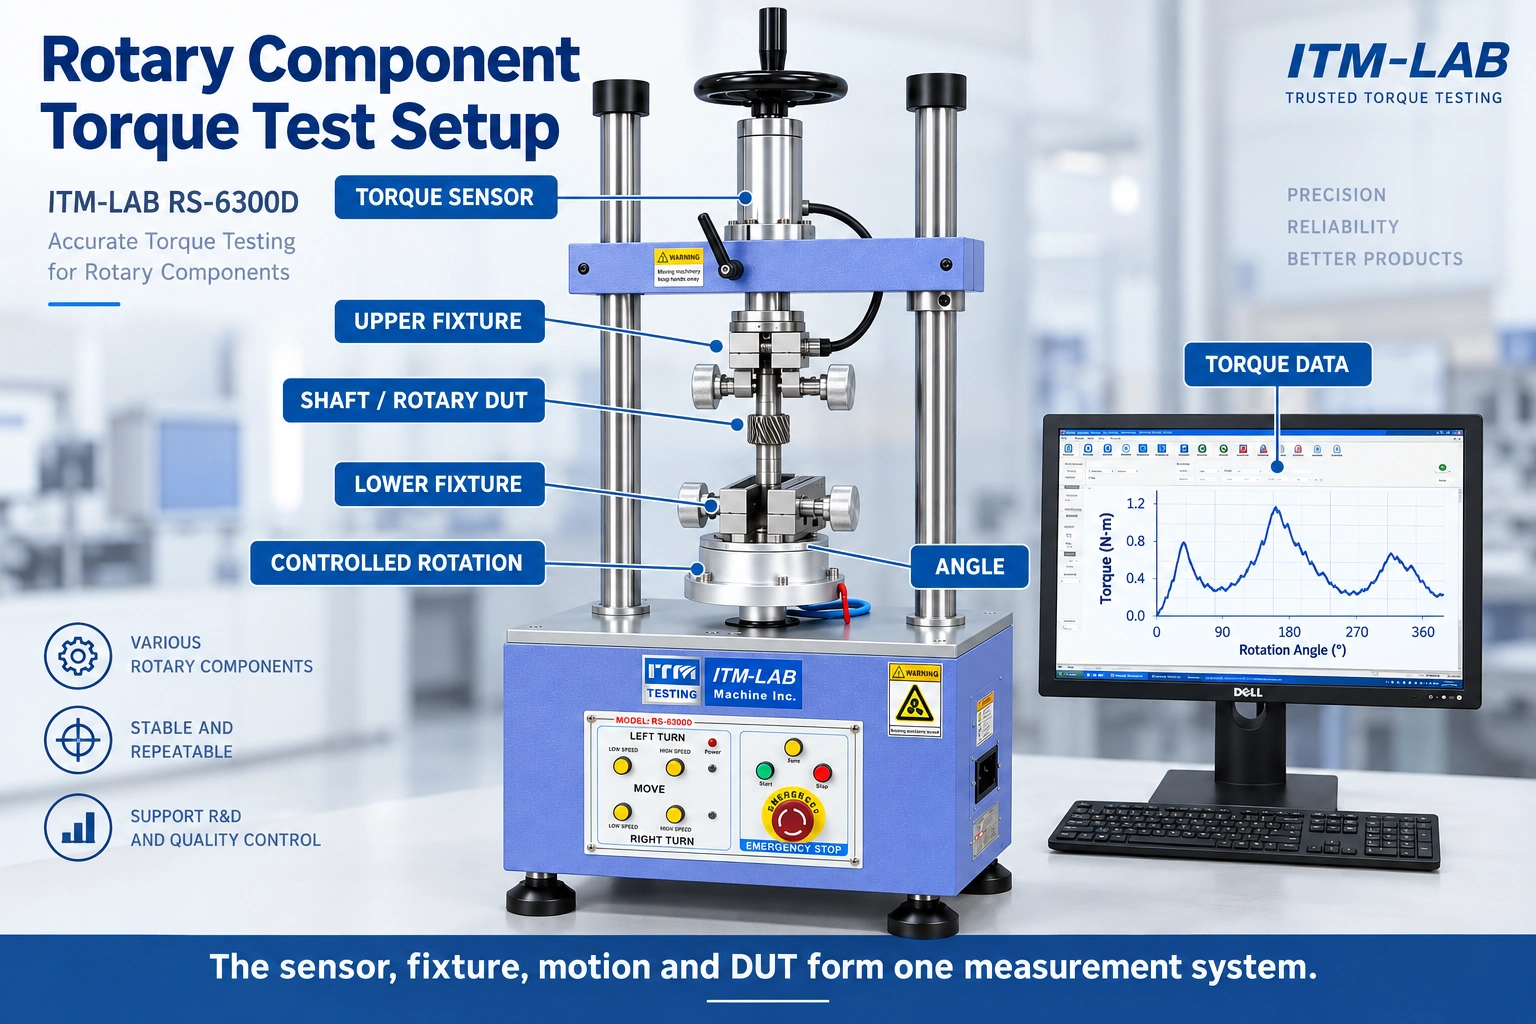
A Torque Tester Is More Than the Torque Sensor
Once we know the DUT and the mechanical event, the equipment discussion becomes much easier.
We look at the complete measurement chain.
Torque range: Does it cover breakaway, running, peak, and expected variation?
Motion: What rotational speed and angle are required?
Direction: CW, CCW, or both?
Fixture: Where can the DUT actually be held without slipping or deformation?
Alignment: What is the functional rotation axis?
Data: Is a peak value enough, or does the engineer need torque against angle?
This is why two components with the same 2 N·m maximum can require different test configurations.
A simple rotary joint may need only a controlled 90° movement and a peak result.
Another component may require several revolutions, low-speed motion, a custom fixture, CW/CCW comparison, and a detailed torque-angle curve.
Same nominal capacity.
Different test.
Where We See These Tests in Practice
The measurement principle is similar across many mechanical products, but the useful result changes with the DUT.
Bearings, Bushings and Seals
These applications often bring breakaway and running torque into the same test.
A bearing or seal assembly may have a noticeable starting event followed by a much lower running region. Lubrication, preload, contact condition, and conditioning history can all matter, so the test procedure needs to keep those variables under control when samples are being compared.
Shafts, Couplings and Rotary Joints
Here, we are often interested in whether resistance remains consistent through the functional motion.
A single peak can be useful for a simple specification, but a torque-angle curve becomes more valuable when the joint feels tight or produces resistance only at a particular position.
Alignment and fixture design also tend to become important as the DUT geometry becomes less symmetrical.
Gears and Adjustment Mechanisms
A repeating torque pattern is not automatically a problem.
A geared mechanism may naturally produce periodic changes as the mechanical interfaces move through rotation. An adjustment mechanism may intentionally have different resistance in different parts of its travel.
Before judging the graph, we need to know what the product is supposed to do.
That sounds basic, but it prevents a common mistake: treating the flattest torque curve as automatically the “best” one.
Before vs. After Durability: Compare More Than the Maximum
Rotary torque testing becomes particularly useful when we compare the same mechanical behavior before and after cycling.
Consider an illustrative assembly.
Baseline
Breakaway: 0.82 N·m
Running Region: 0.55–0.62 N·m
After Cycling
Breakaway: 0.98 N·m
Running Region: 0.65–0.73 N·m
The resistance has changed.
The torque test does not tell us automatically whether the reason is wear, lubricant redistribution, seal behavior, surface changes, preload, or mechanical settling. That requires knowledge of the product and, often, additional inspection.
Now consider another case where the maximum torque barely changes, but a new rise appears around 210° after cycling.
A peak-only comparison could miss it.
Overlaying the baseline and post-cycling curves shows not only how much the rotational resistance changed but where it changed.
All values in these examples are illustrative and are not acceptance criteria.
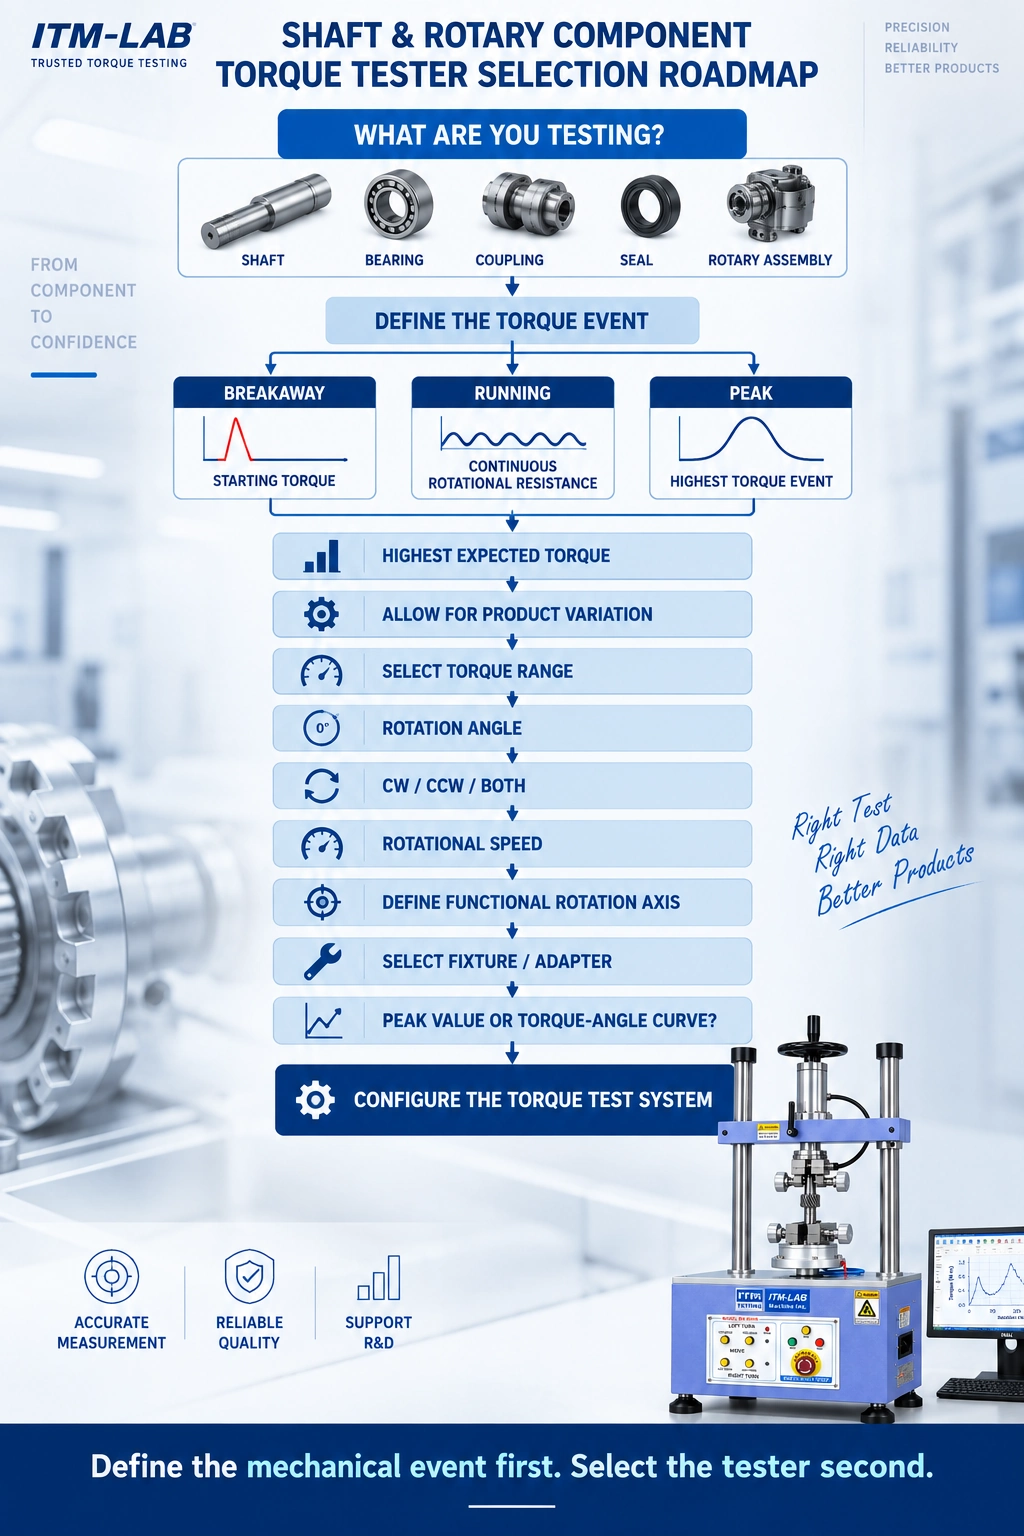
Before You Ask for a Torque Tester, Define These Inputs
A request that says:
“We need a 10 N·m shaft torque tester.”
gives us a capacity.
It does not yet give us a complete test.
For equipment selection, these inputs are much more useful:
DUT: Shaft / Bearing / Coupling / Seal / Rotary Assembly / Other
DUT Dimensions: _____
Shaft / Rotary Interface: _____
Expected Breakaway Torque: _____ N·m
Normal Running Torque: _____ N·m
Highest Expected Peak: _____ N·m
Rotation: _____° / Continuous
Direction: CW / CCW / Both
Rotational Speed: _____ rpm
Required Result: Breakaway / Running / Peak / Torque-Angle Curve
Fixture / Mounting Requirement: _____
Durability / Repeated Cycling: _____
If the expected torque is not known yet, that does not prevent us from discussing the application. A DUT drawing, interface dimensions, photographs, existing test data, or representative sample can help define the next step.
The objective is to configure the torque range, fixture, motion, and data around the real component—not to force the component into a machine selected from one number.
FAQ
What is a shaft torque test?
A shaft torque test measures the rotational resistance or torque response of a shaft or rotary assembly under defined motion. Depending on the application, the required result may include breakaway torque, running torque, peak torque, torque variation, or a complete torque-angle curve.
What is the difference between breakaway torque and running torque?
Breakaway torque is associated with initiating movement from rest. Running torque describes the rotational resistance after movement has begun. The two can differ because the mechanical condition at rest is not necessarily the same as the condition during continued motion.
Is breakaway torque the same as peak torque?
Not necessarily. Breakaway identifies the torque event when motion begins. Peak torque is the highest measured value during the defined test. Breakaway may be the peak, but a higher torque event can occur later in the rotation.
How do you measure rotary torque?
The DUT is mounted in a suitable fixture, aligned with its functional rotation axis, and subjected to controlled rotational motion while torque is measured. When angular position matters, torque and angle can be recorded together to create a torque-angle curve.
How do I select the correct torque sensor range?
Start with the complete torque event. Define the expected breakaway torque, normal running region, highest peak, product variation, and required measurement performance. Selecting the sensor from running torque alone can miss the event that actually determines the required range.
Final Thoughts
When someone gives us one torque value for a rotary component, our next question is usually:
Which torque value is it?
Breakaway tells us what happens as motion begins. Running torque describes resistance after the component is moving. Peak torque identifies the highest event. The torque-angle curve shows where those events occur.
Then we look at the conditions around the measurement: speed, direction, starting position, alignment, fixture, and sensor range.
That is the difference between choosing a torque tester by capacity and configuring a torque test around the actual DUT.
Define the mechanical event first. Select the measurement system second.
Discuss Your Rotary Torque Test
Testing a shaft, bearing, coupling, seal, or another rotary component?
Send ITM-LAB the DUT dimensions, rotary interface, expected breakaway/running/peak torque, rotation angle, direction, speed, fixture requirements, and required test result.
We can use those inputs to evaluate the torque range, fixture, controlled motion, angle measurement, and data configuration around the actual application.
